Showing posts with label stock market. Show all posts

Monday, June 10, 2019

Why stocks are good hedges for inflation.

I was quoted yesterday in the Wall Street Journal on why stocks are good hedges for inflation.
Article is here: https://www.wsj.com/articles/which-is-the-better-inflation-hedge-stocks-or-gold-11560132361?mod=searchresults&page=1&pos=8

Quoting from the article:
The reason stocks are a decent inflation hedge is because corporate earnings grow faster when inflation is higher, and grow more slowly when inflation is lower, according to Richard Warr, a finance professor at North Carolina State University. Consider the growth rate of corporate earnings over all 10-year periods since 1871, according to data compiled by Yale University finance professor (and Nobel laureate) Robert Shiller. The volatility of those growth rates was 21% less on an inflation-adjusted basis than it was on a nominal basis, which Prof. Warr says is a good indication of the extent to which equities are able to hedge inflation.
To be sure, Prof. Warr adds, higher inflation does reduce the present value of the otherwise higher future earnings. But these two effects should more or less cancel each other out over time.
Prof. Warr acknowledges that, over shorter periods of a year or two, stocks often suffer when inflation heats up. His research suggests that is because many investors are guilty of what economists refer to as “inflation illusion.” That is, they focus only on the reduction in the present value of future earnings to which inflation leads, while ignoring the tendency for nominal earnings to grow faster when inflation is higher. So when inflation spikes upward, they sell stocks.
Since the inflation illusion is irrational, it is difficult to predict whether investors will be guilty of it the next time inflation heats up. But Prof. Warr says that if they do and their selling causes the stock market to drop, investors should treat it as a buying opportunity."

Monday, June 13, 2016

MSFT buys LinkedIn

I guess I didn't see this one coming.   http://www.bloomberg.com/news/articles/2016-06-13/microsoft-to-buy-linkedin-in-deal-valued-at-26-2-billion-ipe079k9

I was looking back at my blog posts from 2011, and I was convinced that LinkedIn was overvalued then.  I think it still is, but you'd have done pretty well if you bought the stock at the IPO.  That's why I'm an indexer and not a stock picker!

Wednesday, August 26, 2015

How do we know that the market is going to open "up" (or "down")?

This is a pretty basic question that most finance folks will know the answer to.   How does the media know what the market is going to do when it opens?


Turns out, the information is coming from index futures contracts that trade before the market open.  These futures contracts allow investors to bet on the price of the index (Dow or S&P) at some point in the future.   A nice explanation is on investopedia.  You can see the state of futures contracts on most financial pages - CNBC for example.

Today, the prediction was correct.  The market opened above its prior close.

Monday, August 26, 2013

Why the CEO matters - Microsoft sheds the Ballmer discount.

Here's a clear indication of how a CEO can make a difference -- by quitting.  

Last Friday, Steve Ballmer, CEO of MSFT, announced that he would retire.   The market's reaction was pretty unequivocal.


Sunday, April 7, 2013

How not to market time, and why the EMH isn't a cult.

A student forwarded me this link about the market timing escapades of a couple of individual investors.   Unfortunately the two individuals sold when the market collapsed and then bought back in only after the market had been rising for a while.   Buy high and sell low is not a good trading strategy.

I agree with the author of the article that there are probably many people who are timing the market this way, and suffering the disastrous financial consequences.  But then the author surprised me and went in a completely different direction.

He argues, that the problem is partly due to:
"...the spreading influence of a cult called the Efficient Market Hypothesis, which downplays the importance of the actual price you pay for stocks. It is horrifying how many financial advisers have bought into the nonsense of the EMH, often without even understanding it."
The author states that what investors should do is buy low and sell high.  And the way to figure out when these times are is to follow the old Warren Buffet adage of buying when others are fearful and selling when others are greedy.

Although it sounds easy, this is very hard impossible to do.  For example, today the market is doing really well.  Are people greedy today?   Maybe, but if I sell today and the market goes up another 20%, then I have lost out big time.  What if the market falls 10% tomorrow?  Are people fearful then?  Is that a buying opportunity?  What happens if the following it falls another 20% after I bought in?

It is easy after the event to see when we should have bought and sold, but at any given point in time, we cannot know what the market will do tomorrow or in 6 months time.   This is what the Efficient Markets Hypothesis states.   It doesn't not state the prices are not important.  Far from it, it states that prices incorporate all past information, but they don't tell us anything about the future.   There is no EMH cult, and to say that EMH is nonsense is just silly - the evidence supporting the EMH is vast and very robust.

As always, the conclusion is the same.  You cannot reliably predict future prices and you cannot time the market.   The only solution for individual investors (or any investors) is to pick a risk level that you are comfortable with and then ride the ups and downs of the market.   In the end you'll come out ahead.

HT: John.


Wednesday, March 6, 2013

Dow Jones - record high?

The "big" news yesterday was that the Dow Jones Industrial Average closed at a record high.  While this is an attention grabbing headline - it is actually pretty meaningless.  

The Dow Jones Industrial Average is a price weighted index.  In short the index is computed by adding up the prices of 30 big stocks and then dividing them by a number called the divisor.   As a result, the index only measures changes in prices and is based on a very arbitrary computation.  

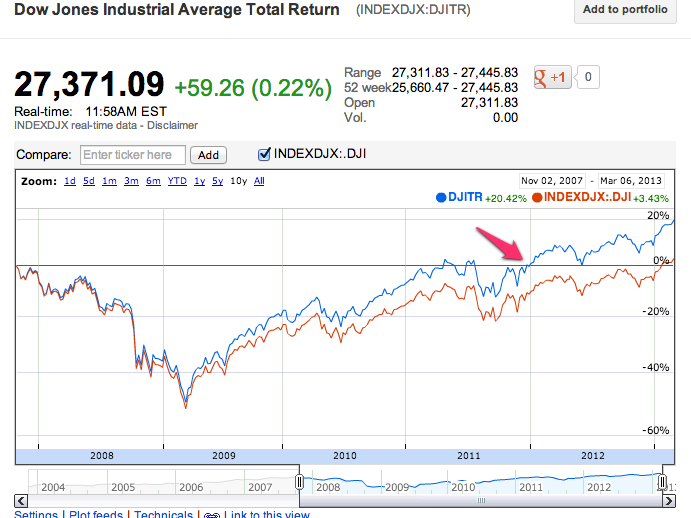
A better way of measuring the performance of the Dow Jones stocks is the Dow Jones Industrial Total Return Index which includes dividends paid on the stocks.

We can see the difference quite clearly:


The blue line is the total return index.  I've shown them both from the last record level of the price index which was October 2007.   What is clear is that the total return index beat its previous record around the end of 2011.  To date it is up 20% since then.  

This clearly shows the importance of dividends in computing a return and why just looking at a price index is really pretty pointless.


Wednesday, February 6, 2013

Are we still talking about the Fed Model?

Yes, but not in a very nice way.

A great quote:

The fallacy of the model is quite simple. THERE IS NO SUCH THING AS EARNINGS YIELD. The earnings yield is simply the inverse of the P/E ratio whereby corporate earnings are divided by the price of the market. However, as an investor in a stock you do not receive the earnings yield in the form of a cash payment.   However, YOU DO receive the interest yield from bonds.


If you don't know what the Fed Model is - you can check an earlier post on the subject.


Tuesday, April 17, 2012

More on volatility and the level of the market

John Cochrane (aka the Grumpy Economist) talks about volatility and the level of the market.  I blogged on this recently here.

John takes things a bit further and throws a little math at the problem.  He has some interesting analysis, although he concludes that our current state of asset pricing is able to fully account for the effect (in some many words).


So why did Apple stock drop?

Was it the thousand dollar price targets?


Monday, March 12, 2012

The VIX is low...

This is relevant to my MBA students who currently have an assignment on implied volatility:

The VIX has declined steadily over the past few months, and at the same time, stocks have rebounded.  
From the graph it appears that the VIX is quite negatively correlated with the S&P 500.  Something that is pointed out here and here.  

I decided to grab some data from yahoo finance and look at the correlations.  First of all if you just look at the raw correlation of the VIX and the S&P 500 from 1990 you get a small positive correlation of about 0.14.  However, if you look at the daily change in the VIX and the change in the level of the index, the correlation is -0.57.  That's a pretty large negative correlation.   

What is unclear, of course, is what is causing what?  Is higher volatility hurting prices or is that falling prices increases volatility?  An obvious thing to look at is the correlation between the prior day change in the VIX and the current day change in the index.  Not surprisingly, this correlation is close to zero indicating that there isn't a simple trading rule.  (If there was, do you think I'd blog it?)

Still, the VIX is a pretty interesting index.

The real Dow index would include dividends and inflation

Because the Dow (and other stock indices) don't account for dividends, it is argued that the "true" level of the Dow should be much higher.    Here's an interesting article that shows the effects of dividends and inflation on stock returns.

Thursday, February 9, 2012

The Dow is a horribly constructed index

Another nice post from Kid Dynamite.  This time having a go at the Dow Jones Average.   If you don't know why the S&P 500 is fundamentally different from the Dow 30 (apart from the little matter of 470 stocks), then you need to read this.

Monday, January 30, 2012

Facebook's stock symbol

So the question of the day - at least on Twitter, is what should Facebook's stock symbol be when it goes public?  POKE was suggested, but I am guessing something more boring like "FB".

Note that F is already taken by Ford.   An interesting point of comparison, the expected market cap for Facebook is around $100 Billion, and for Ford: around $47 Billion.

Assuming a valuation similar to GOOG, and a PE of 20, Facebook would need to generate around $5 Billion of earnings per year to justify a $100 Billion market cap.


Thursday, January 19, 2012

GOOG down 9%

Google missed its earnings forecast today and the stock fell 9% in after hours trading.   This is significant because at some point growth stocks become boring stocks.  It happened to Microsoft, Home Depot, and many others.  Sooner or later it will happen to Google (and Apple).

What's going on with inflation?

I recently posted an article on the Poole College Thought Leadership page titled: " What's going on with inflation?" .  This w...